How to Calculate Cap Rate
By Hami Tahm | Updated 2 July 2026 | 12 min read
How is cap rate calculated?
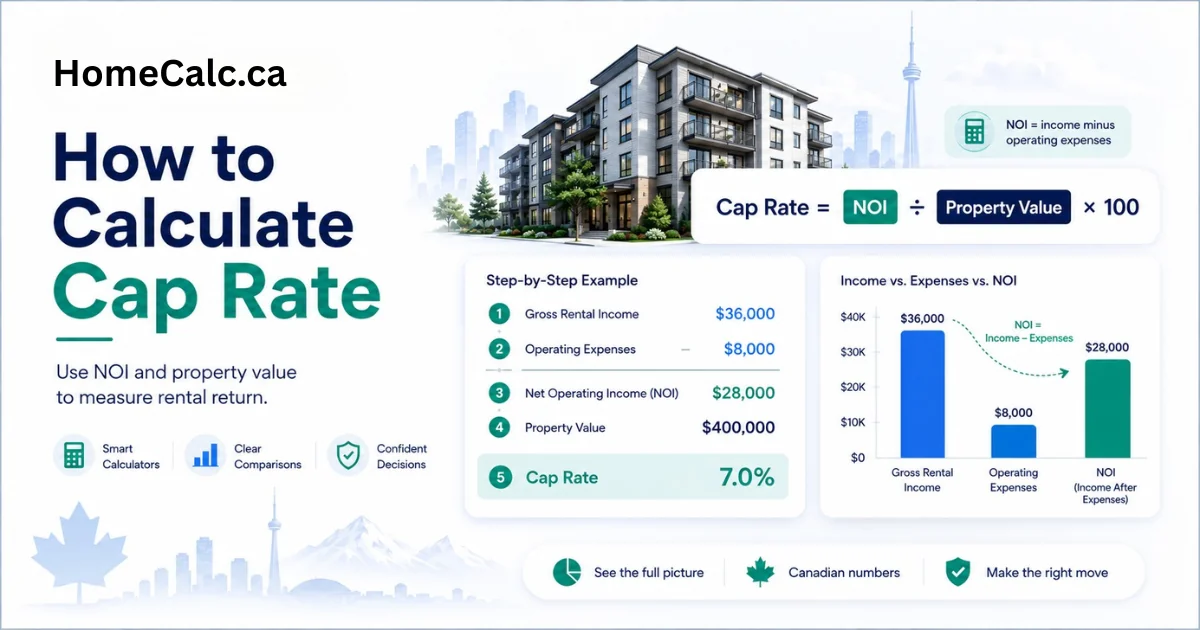
Cap rate is calculated by dividing a property's annual net operating income (NOI) by its current market value or purchase price, then multiplying by 100. Formula: Cap Rate = (NOI ÷ Property Value) × 100. NOI equals gross rental income minus vacancy allowance and all operating expenses — excluding mortgage payments. A $600,000 property with $30,000 in annual NOI has a cap rate of 5%.
Key Takeaways
- Cap Rate = (Net Operating Income ÷ Property Value) × 100. It measures income return independent of financing — mortgage payments are never included in the calculation.
- Net operating income (NOI) = gross rent minus vacancy allowance minus operating expenses. Always use actual or market-rate rents, not asking rents, for accuracy.
- The reverse formula lets you set a maximum purchase price: Property Value = NOI ÷ (Cap Rate ÷ 100). Use this to determine what you should pay at your target return.
- You can also calculate NOI from a known cap rate and price: NOI = Cap Rate × Property Value ÷ 100 — useful for verifying a seller's claimed income.
- In Canada, residential income property cap rates typically range from 3.5–7% depending on market — lower in Toronto and Vancouver, higher in secondary cities.
This guide covers the full cap rate formula, how to calculate NOI correctly, step-by-step worked examples, reverse cap rate calculations, and Canadian city benchmarks. Use our free cap rate calculator to run these calculations on any Canadian property.
How Is Cap Rate Calculated?
Cap rate is calculated by dividing a property's annual net operating income (NOI) by its current market value or purchase price, then multiplying by 100. The formula is: Cap Rate = (NOI ÷ Property Value) × 100. A property worth $600,000 generating $30,000 in annual NOI has a cap rate of 5%. NOI equals gross rental income minus vacancy allowance and all operating expenses, excluding mortgage payments.
The Cap Rate Formula
The cap rate formula has three algebraic variations — all rearrangements of the same equation. See our cap rate definition for a full glossary entry.
| Formula Variant | Use Case | Formula |
|---|---|---|
| Cap Rate | Evaluate a property's return | Cap Rate = (NOI ÷ Property Value) × 100 |
| NOI from Cap Rate | Verify seller's income claims | NOI = Cap Rate × Property Value ÷ 100 |
| Value from Cap Rate | Set maximum purchase price | Value = NOI ÷ (Cap Rate ÷ 100) |
What Is Included — and Excluded — From the Cap Rate Calculation
Included in NOI (income): base rent from all units, parking income, laundry and storage income, and any other regular tenant payments.
Included in NOI (expenses subtracted): property taxes, building insurance, property management fees (8–12% of gross rents), routine maintenance and repairs, landlord-paid utilities (heat, water, common area hydro), and a vacancy allowance of 3–8%.
Excluded from NOI: mortgage principal payments, mortgage interest, income taxes, capital expenditures (roof, HVAC, major repairs), and depreciation.
Cap Rate Is Always Pre-Financing
Never include mortgage principal or interest payments in your NOI calculation. Cap rate is a property-level metric, independent of how the purchase is financed. Two investors buying the same property with different down payments will have the same cap rate but different cash-on-cash returns.
How to Calculate Net Operating Income (NOI)
Net operating income (NOI) is the annual income a property generates after deducting all operating expenses, but before mortgage payments and income tax. To calculate NOI: start with gross annual rental income, subtract a vacancy allowance (typically 3–8% of gross rents), then subtract operating expenses including property taxes, insurance, property management fees (8–12% of gross rents), maintenance, and landlord-paid utilities.
NOI Calculation — Step by Step
| Line Item | Example ($600K Property) | Notes |
|---|---|---|
| Gross Annual Rent | $42,000 | 2 units × $1,750/month |
| Vacancy Allowance (5%) | −$2,100 | 3–8% typical; use local vacancy rate |
| Effective Gross Income | $39,900 | |
| Property Taxes | −$4,800 | Varies by municipality |
| Insurance | −$1,800 | |
| Property Management (9%) | −$3,780 | 8–12% of gross rents |
| Maintenance & Repairs | −$3,000 | ~0.5–1% of property value per year |
| Net Operating Income (NOI) | $26,520 | Pre-debt income used for cap rate |
| Cap Rate | 4.42% | $26,520 ÷ $600,000 × 100 |
Common NOI Calculation Mistakes
Common Investor Mistake: Do NOT Include These in NOI
These four errors produce a falsely low or inflated cap rate:
- Using gross rent without vacancy: Always subtract a vacancy allowance. Even stabilized properties carry credit loss risk. Omitting it overstates NOI.
- Omitting property management when self-managing: Use 8–12% market rate even if you manage yourself. If you later hire a manager, your actual NOI will match your underwriting.
- Including mortgage interest: Cap rate is a pre-financing metric. Adding debt service distorts the comparison across properties with different capital structures.
- Using asking rents vs. achievable market rents: Going-in cap rate uses actual current NOI. Pro forma cap rate uses projected rents — label which you are using.
How to Calculate NOI from Cap Rate — Reverse Calculations
Use Reverse Cap Rate to Negotiate Purchase Price
If you have a target cap rate (e.g., 5.5%) and know the property's NOI, you can calculate the maximum price you should pay: Value = NOI ÷ (Cap Rate ÷ 100). This is the standard method institutional investors use to anchor their offers. Example: $28,000 NOI ÷ 0.055 = $509,090 maximum price.
To calculate NOI from a known cap rate and property value, rearrange the cap rate formula: NOI = Cap Rate × Property Value ÷ 100. A $700,000 property at a 5% cap rate implies an NOI of $35,000 per year. To calculate implied property value from NOI and a target cap rate: Value = NOI ÷ (Cap Rate ÷ 100). This reverse calculation is the standard method for setting a maximum purchase price based on your target return.
Using Reverse Cap Rate to Set Maximum Purchase Price
If your target cap rate is 5.5% and the property generates $28,000 in annual NOI, the maximum price you should pay is: $28,000 ÷ 0.055 = $509,090. If the seller is asking $550,000, the implied cap rate is $28,000 ÷ $550,000 = 5.09% — below your threshold. Use this as your negotiation anchor: the asking price implies you are accepting a lower return than your underwriting requires.
This is how income-property appraisers determine value — not comparable sales, but income capitalization. It is also how institutional buyers price offers: find market cap rate, apply to subject NOI, arrive at bid price.
Calculating NOI from Cap Rate to Verify Seller Claims
If a seller claims $35,000 NOI on a $700,000 property, the implied cap rate is 5.0%. Cross-check by requesting rent rolls, property tax bills, insurance invoices, and management agreements. Apply the formula in reverse: NOI = 5.0% × $700,000 ÷ 100 = $35,000. If the verified NOI is lower, the cap rate — and the justified price — drops accordingly.
Use our cap rate calculator to verify seller income claims against your own expense assumptions and city benchmarks.
Cap Rate Calculation — Worked Examples
Use these step-by-step examples to apply the cap rate formula to real scenarios.
Example 1 — Single-Family Rental ($500K Purchase)
| Input | Value |
|---|---|
| Purchase Price | $500,000 |
| Gross Annual Rent | $30,000 |
| Vacancy (5%) | −$1,500 |
| Property Taxes | −$3,600 |
| Insurance | −$1,500 |
| Management (9%) | −$2,700 |
| Maintenance | −$2,500 |
| NOI | $18,200 |
| Cap Rate | 3.64% |
A 3.64% cap rate is typical for an Ontario single-family rental in a mid-tier GTA market. At this yield, the property is an appreciation play — thin income yield before financing costs.
Example 2 — Multi-Family Duplex ($750K Purchase)
| Input | Value |
|---|---|
| Purchase Price | $750,000 |
| Gross Annual Rent (2 units) | $52,800 |
| Vacancy (4%) | −$2,112 |
| Property Taxes | −$6,000 |
| Insurance | −$2,400 |
| Management (8%) | −$4,224 |
| Maintenance | −$4,500 |
| NOI | $33,564 |
| Cap Rate | 4.48% |
The duplex yields 4.48% — meaningfully higher than the single-family example due to lower per-unit purchase cost and the duplex income premium. Multi-family (2–4 units) often produces a 0.5–1% cap rate premium over single-family in the same submarket. Use our house hacking calculator to model owner-occupied multi-family scenarios.
Cap Rate vs. Other Investment Return Metrics
Cap rate measures income return independent of financing and is used primarily for comparing properties at the market level. Cash-on-cash return adds the effect of leverage — mortgage debt — and measures actual cash yield on equity invested. Gross Rent Multiplier (GRM) is a quicker but less rigorous ratio that ignores operating expenses entirely. Use cap rate to screen and compare; use cash-on-cash return to evaluate a specific deal's actual yield. Our renovation ROI calculator can help assess how capital improvements shift NOI and therefore cap rate.
Cap Rate vs. Cash-on-Cash Return
Cap rate is a property-level metric — it is consistent regardless of who buys the property or how they finance it. Cash-on-cash return is investor-level — it changes based on your down payment, interest rate, and loan terms. Two investors buying the same property with different leverage will have the same cap rate but different cash-on-cash returns.
If your cap rate is lower than your mortgage rate, you are in negative leverage — the property's income does not cover the cost of debt. At current Canadian mortgage rates (5–6%), Toronto and Vancouver properties at 3–4% cap rates are in negative leverage. See our house flipping calculator for return metrics on fix-and-flip investment scenarios.
Cap Rate vs. Gross Rent Multiplier (GRM)
GRM = Purchase Price ÷ Annual Gross Rent. A GRM of 15 means you pay 15 years' worth of gross rent as the purchase price. GRM ignores operating expenses — it is a crude screening tool only, not a reliable underwriting metric. Use GRM for a 30-second deal screen; use cap rate for actual underwriting. Our 70% rule calculator is a companion screening tool for quick deal assessment.
For a regional benchmark comparison of cap rates across Canadian cities, see the cap rate benchmarks by market table on our cap rate calculator.
Cap Rate Variations: Acquisition, Going-In, Stabilized & Implied
Not all cap rates are equal. Four variations matter for Canadian investors:
Acquisition Cap Rate: Calculated using the purchase price rather than current market value. Used to evaluate a deal at the time of purchase — it tells you the yield you are buying at, not what the market says the asset is worth today.
Going-In Cap Rate: The cap rate at time of purchase based on current actual NOI. May include existing vacancy or deferred maintenance that suppresses income. This is the most conservative starting point for underwriting.
Stabilized Cap Rate: Cap rate based on projected NOI at full occupancy and market rents — used in development underwriting and value-add analysis. Reflects what the property should earn once repositioned, not what it earns today.
Market Cap Rate: Derived from comparable sales — what investors are paying relative to NOI for similar properties in the same submarket. This is the benchmark used in the reverse valuation formula.
Implied Cap Rate: Backed out from a known transaction price and known NOI — useful for benchmarking when direct market data is sparse. Formula: Implied Cap Rate = NOI ÷ Sale Price × 100.
What Does a Specific Cap Rate Mean?
Cap rate measures a property's income return relative to its value, assuming no financing. A 5% cap rate means the property generates 5 cents of NOI for every dollar of value. It does not account for mortgage costs.
| Cap Rate Range | What It Signals | Typical Canadian Markets |
|---|---|---|
| 2–3% | Premium trophy asset, appreciation-dominant, minimal cash flow | Downtown Vancouver, Toronto core |
| 3–4% | Standard residential, low yield, high asset quality | Toronto/GTA, Vancouver suburbs |
| 4–5% | Balanced income/growth, healthy residential market | Ottawa, Montreal, Victoria |
| 5–7% | Stronger yield, value-add or secondary cities, moderate risk | Calgary, Edmonton, Winnipeg |
| 7–9% | High yield — investigate quality of income and vacancy | Smaller cities, rural, some distress |
| 10%+ | Distressed asset, very high risk, or unsustainable NOI — requires deep diligence | Rare in major markets — red flag |
| 12%+ | Near-certain distress signal in any Canadian major market | Verify NOI before proceeding |
A higher cap rate always signals either higher risk, lower quality of income, or a less desirable location — not simply a better deal.
A 12% cap rate typically signals a distressed or high-risk property. In Canada's major markets, cap rates this high usually indicate significant vacancy, deferred maintenance, a difficult rental market, or a motivated seller. Before treating a 12% cap rate as an opportunity, verify the NOI is real and sustainable — not inflated by unsustainable rents.
Canadian Cap Rate Context: City Benchmarks & Negative Leverage
A good cap rate in Canada depends on the city and asset type. Toronto and Vancouver residential properties typically trade at 3–5%, reflecting high appreciation expectations and low yield. Calgary and Edmonton range from 4.5–6.5%. Ottawa and Montreal sit between 4–6%. Cap rates above 7% in major markets usually indicate distress, vacancy issues, or above-average risk.
| City / Region | Residential (SFH/Condo) | Small Multifamily (4–12 units) | Key Market Driver |
|---|---|---|---|
| Toronto / GTA | 3–5% | 4–6% | Appreciation, tight vacancy |
| Vancouver / Metro | 2.5–4% | 3.5–5% | Land value, foreign demand |
| Ottawa | 4–5.5% | 4.5–6% | Government employment, stable demand |
| Montreal | 4–6% | 4.5–6.5% | Rent control limits NOI growth |
| Calgary | 4.5–6.5% | 5–7% | Energy sector, no provincial income tax |
| Edmonton | 4.5–6.5% | 5–7.5% | Affordability, strong rental demand |
| Winnipeg | 5.5–7.5% | 6–8% | Lower asset prices, stable income |
| Halifax | 4.5–6% | 5–7% | Atlantic Canada growth market |
Ontario rent control note: Properties first occupied before November 15, 2018 are subject to Ontario's provincial rent guideline increase cap. This limits NOI growth on rent-controlled units and suppresses long-term cap rate improvement on older stock — factor this into your NOI trajectory when underwriting older Toronto or Hamilton assets.
Use the cap rate calculator to compare your property's yield against these benchmarks with your specific numbers.
Negative Leverage Warning
If your property's cap rate is lower than your mortgage interest rate, you are in negative leverage. Example: a 3.5% cap rate with a 5.5% mortgage means the property's income does not cover the cost of debt — you are losing money on operations before appreciation. This is the norm in Vancouver and Toronto for residential properties.
Every dollar borrowed works against you until appreciation recovers the gap. Model cash-on-cash return alongside cap rate for any leveraged acquisition.
▶ More Canadian real estate tools
- Cap Rate Calculator— Calculate cap rate, reverse valuation, and cash-on-cash return for any Canadian property.
- Rental Property Mortgage Calculator— See monthly payment and interest cost at any down payment size.
- Closing Costs Calculator Canada— Estimate land transfer tax, legal fees, and total closing costs.
- House Hacking Calculator— Model income, expenses, and cap rate for owner-occupied multi-unit properties.
Frequently Asked Questions
This article is for informational and educational purposes only and does not constitute financial, real estate, or investment advice. Cap rate calculations are estimates and depend on the accuracy of inputs including rental income, vacancy rates, and operating expenses. Worked examples use illustrative figures that may not reflect conditions in your market. Regional cap rate ranges are approximate and subject to change. Consult a licensed real estate agent, accountant, or financial advisor before making investment decisions.
Sources: CMHC Rental Market Reports · Investopedia net operating income formula · Investopedia capitalization rate formula · Financial Consumer Agency of Canada · CMHC Housing Market Outlook